
TL;DR:
- Effective test coverage estimation focuses on risk-based effort allocation rather than aiming for 100% coverage.
- Compatibility and boundary testing are crucial for web and mobile apps to prevent costly failures.
- Coverage metrics indicate code execution but do not guarantee quality; prioritizing business-critical scenarios is more impactful.
Test coverage estimation is one of the most misunderstood disciplines in software project management. Many teams assume that higher coverage percentages automatically produce better software, but that assumption routinely wastes budget and delays releases. Test coverage estimation involves predicting and planning the extent of testing needed to achieve optimal quality within time and budget constraints. For web and mobile app projects specifically, where compatibility matrices and evolving requirements multiply complexity, getting estimation right from the start is the difference between a profitable release and a costly rework cycle.
Table of Contents
- What is test coverage estimation?
- Core methodologies: Techniques you need to know
- Web and mobile focus: Optimizing compatibility and boundary coverage
- What coverage metrics really tell you—and what they don't
- A smarter path: Quality-driven coverage beats chasing 100%
- Take the next step: Estimate costs and optimize your coverage
- Frequently asked questions
Key Takeaways
| Point | Details |
|---|---|
| Focus on what matters | Prioritize critical business and risk areas instead of chasing 100% test coverage. |
| Choose the right methods | Combine risk-based estimation, WBS, and analytics for precise test planning. |
| 80% is often enough | Targeting 80% effective coverage usually delivers better ROI than aiming for complete coverage. |
| Web/mobile need special focus | Include device/OS/network compatibility and edge cases to lower risks in your test strategy. |
| Tools maximize efficiency | Use project calculators and analytics platforms to optimize resources and estimation accuracy. |
What is test coverage estimation?
Test coverage estimation is the structured process of predicting and planning the extent of testing needed to deliver quality software under real budget and time limits. It is not simply counting lines of code tested. It encompasses multiple coverage dimensions: statement coverage (which lines execute), branch coverage (which logic paths run), requirements coverage (which specified behaviors are validated), and compatibility coverage (which device, OS, and browser combinations are verified).
Understanding estimating testing efforts correctly means separating coverage metrics from coverage value. A metric tells you what was exercised. Value tells you whether what was exercised actually matters to the business.
Several persistent misconceptions derail project teams before testing even begins:
- Higher percentage always means better quality. A 95% statement coverage score can still miss every critical payment flow if test design is poor.
- 100% coverage is the target. Achieving 100% requires exponentially more effort for diminishing returns, and it is practically unachievable for dynamic mobile environments.
- Coverage works the same across all software types. A fintech app and a content publishing platform have fundamentally different risk profiles, which means their optimal coverage levels differ significantly.
- Coverage tools measure everything that matters. Tools measure what was executed, not whether the execution produced correct business outcomes.
"80% coverage, not 100%, is usually optimal for real-world projects." Teams that internalize this principle allocate resources to risk-weighted scenarios rather than chasing code coverage limitations that add cost without adding safety.
Defining the right estimation scope early in the project lifecycle prevents scope creep in the test plan and keeps QA budgets predictable. Teams that skip this step frequently discover mid-sprint that their test suite is either too shallow to catch regressions or too broad to execute within the sprint window.
With the basics and stakes clear, let's detail the main methodologies behind effective test coverage estimation.
Core methodologies: Techniques you need to know
Five key methodologies dominate professional test estimation practice: risk-based testing, Work Breakdown Structure (WBS), Functional Point Analysis (FPA), Wideband Delphi, and 3-Point Estimation. Each serves a different project context.
| Technique | Best for | Key input | Team maturity needed |
|---|---|---|---|
| Risk-based testing | High-stakes flows, fintech, healthcare | Risk matrix, defect history | Intermediate to senior |
| WBS | Large, modular projects | Feature list, sprint plan | Any level |
| FPA | Requirement-heavy enterprise apps | Functional specs | Senior analysts |
| Wideband Delphi | Novel or uncertain scope | Expert consensus | Senior team |
| 3-Point Estimation | Budget forecasting | Optimistic/pessimistic/likely | Any level |
Risk-based methods allocate 60 to 70% of testing effort to critical high-risk areas, making them the most cost-efficient approach for web and mobile apps where payment, authentication, and data sync flows carry the highest failure cost. Applying a risk matrix follows a clear sequence:
- Identify all testable features and integration points across the application, including third-party APIs and device-specific behaviors.
- Score each item using Risk = Likelihood x Impact, assigning numerical values so the matrix is objective rather than opinion-driven.
- Allocate test effort proportionally, directing the majority of test cycles toward Tier 1 risks and reducing effort for low-risk display or static content features.
- Review and recalibrate the matrix at each sprint boundary as new defect data emerges.
WBS pairs well with risk-based approaches because it structures the test plan into discrete, estimable work packages. FPA is valuable when the project has detailed functional specifications, allowing effort to be calculated from the number and complexity of functional units. Wideband Delphi is best reserved for greenfield projects where historical data is absent and expert judgment must substitute. 3-Point Estimation reduces forecast uncertainty by averaging optimistic, pessimistic, and most likely scenarios, which is particularly useful when presenting budget ranges to stakeholders.
Avoiding common estimation pitfalls requires selecting the right method for the project's risk profile and maturity level rather than defaulting to whichever technique the team used last. Review a broader techniques overview to match method to context precisely. Teams that combine software development cost estimation with test estimation from the outset produce more accurate total project budgets.
Pro Tip: Always integrate historical defect data with your risk estimates. Teams that feed prior release defect density into their risk matrix consistently achieve higher ROI on testing investment than those relying on intuition alone. Structured project sizing process frameworks support this integration effectively.
With the methods mapped out, it's essential to focus on what's unique about testing for web and mobile apps.
Web and mobile focus: Optimizing compatibility and boundary coverage
Web and mobile projects introduce a layer of complexity that desktop-only applications rarely face: the compatibility matrix. Compatibility coverage and edge cases in high-risk flows such as payments and authentication are essential for mobile QA, not optional additions. A single untested OS and browser combination can produce checkout failures that affect a significant user segment.

Device matrix selection should be driven by analytics, not assumption. Prioritizing device matrix from real user analytics and applying boundary coverage to Tier 1 risks delivers the most efficient use of test resources. Pull your app's actual device and OS distribution data, then build your compatibility matrix around the top 80% of user sessions.
A tiered testing focus helps allocate effort rationally:
| Tier | Feature category | Coverage target | Rationale |
|---|---|---|---|
| T1 | Payments, authentication, data sync | 90%+ | Direct revenue and security impact |
| T2 | Content display, navigation, notifications | 70-80% | User experience, moderate business risk |
| T3 | Static pages, help content, settings | 50-60% | Low failure cost, infrequent change |
Boundary and edge cases that teams frequently skip but should not include:
- Network interruption mid-transaction, particularly for payment and booking flows on mobile networks.
- Session timeout handling when users switch between apps on mobile operating systems.
- Input boundary values at field minimums and maximums, especially for numeric and date inputs.
- Locale and currency formatting for apps targeting multiple geographic markets.
- Low-memory device behavior for feature-rich mobile apps on older hardware.
For effort estimation for app projects, the compatibility matrix directly influences the total test execution time and therefore the QA line item in the project budget. Teams that ignore this connection routinely underestimate testing costs. Functional tests typically achieve around 35% coverage in standard execution windows, while performance tests yield only 8.8% coverage under the same constraints, which underscores why test type selection matters as much as volume. Understanding application development cost holistically requires factoring in these QA dimensions from the earliest planning stages.
After prioritizing the practical layers of web and mobile testing, let's examine what the numbers reveal and where metrics fall short.
What coverage metrics really tell you—and what they don't
Coverage metrics are indicators, not guarantees. Understanding their limits prevents misallocation of QA budget and false confidence in release readiness.
What coverage metrics reveal:
- Statement coverage shows which code lines were executed, helping identify dead code and untested paths.
- Branch coverage confirms that both true and false outcomes of conditional logic have been exercised.
- Requirements coverage tracks which specified behaviors have at least one associated test case.
What coverage metrics miss:
- Whether the tested code produced correct outputs under real-world data conditions.
- Security vulnerabilities that require adversarial test design rather than structural coverage.
- Performance degradation under concurrent load, which structural coverage tools cannot detect.
- Business logic errors where code executes correctly but produces wrong outcomes for edge-case inputs.
Performance tests yield only 8.8% coverage versus approximately 35% for functional tests, which means a test suite weighted toward performance validation will show low coverage numbers despite delivering high business value. Conversely, high test coverage does not equal quality because business-critical tests matter most, not raw percentage scores.
Defect density, the number of confirmed defects per unit of code or feature, adds depth that raw coverage percentages cannot provide. Risk-adjusted coverage, which weights coverage scores by the business impact of each feature, gives project managers a more actionable view of release readiness than a single aggregate number.
Pro Tip: Combine AI and ML-assisted test selection with your coverage estimation process. Analytics-driven tools can reduce test execution time by up to 90% by identifying which tests are most likely to catch regressions based on recent code changes, freeing budget for exploratory and boundary testing where human judgment adds the most value.
Avoiding estimation mistakes in this area means resisting stakeholder pressure to report a single coverage percentage as a proxy for quality. Instead, present a risk-weighted coverage summary that maps tested scenarios to business outcomes. Empirical coverage benchmarks from published research support the 80% target as the practical optimum for most commercial software projects.
Armed with actionable metrics and context, here's how leaders should approach real-world project estimation.
A smarter path: Quality-driven coverage beats chasing 100%
The conventional push for 100% test coverage reflects a measurement culture that prioritizes visible metrics over business outcomes. In practice, the teams that ship reliable web and mobile apps are not the ones with the highest coverage scores. They are the ones that consistently estimate testing efforts with precision, review risk weightings at each iteration, and adapt their test scope as product priorities shift.
Chasing 100% coverage on a rapidly evolving mobile product is a resource allocation error. New features, OS updates, and user behavior shifts mean that a test suite optimized for last quarter's risk profile is already partially obsolete. Smart project managers treat test coverage estimation as a living process, not a one-time deliverable.
The most effective teams build analytics-led device matrices, apply risk-based effort allocation, and measure defect escape rates alongside coverage percentages. They set coverage targets by feature tier, not by a single project-wide number. And they treat the 80% threshold not as a ceiling but as a baseline from which risk-weighted adjustments are made for the highest-stakes flows.
The goal is straightforward: test what matters most, measure impact, and adapt relentlessly. That discipline produces better outcomes than any coverage percentage target ever will.
Take the next step: Estimate costs and optimize your coverage
Smart test coverage estimation does not operate in isolation. It is one input into a broader project planning process that determines whether a web or mobile app ships on time and within budget. Having the right tools to model those tradeoffs from the start accelerates decision-making and reduces the risk of costly mid-project corrections.
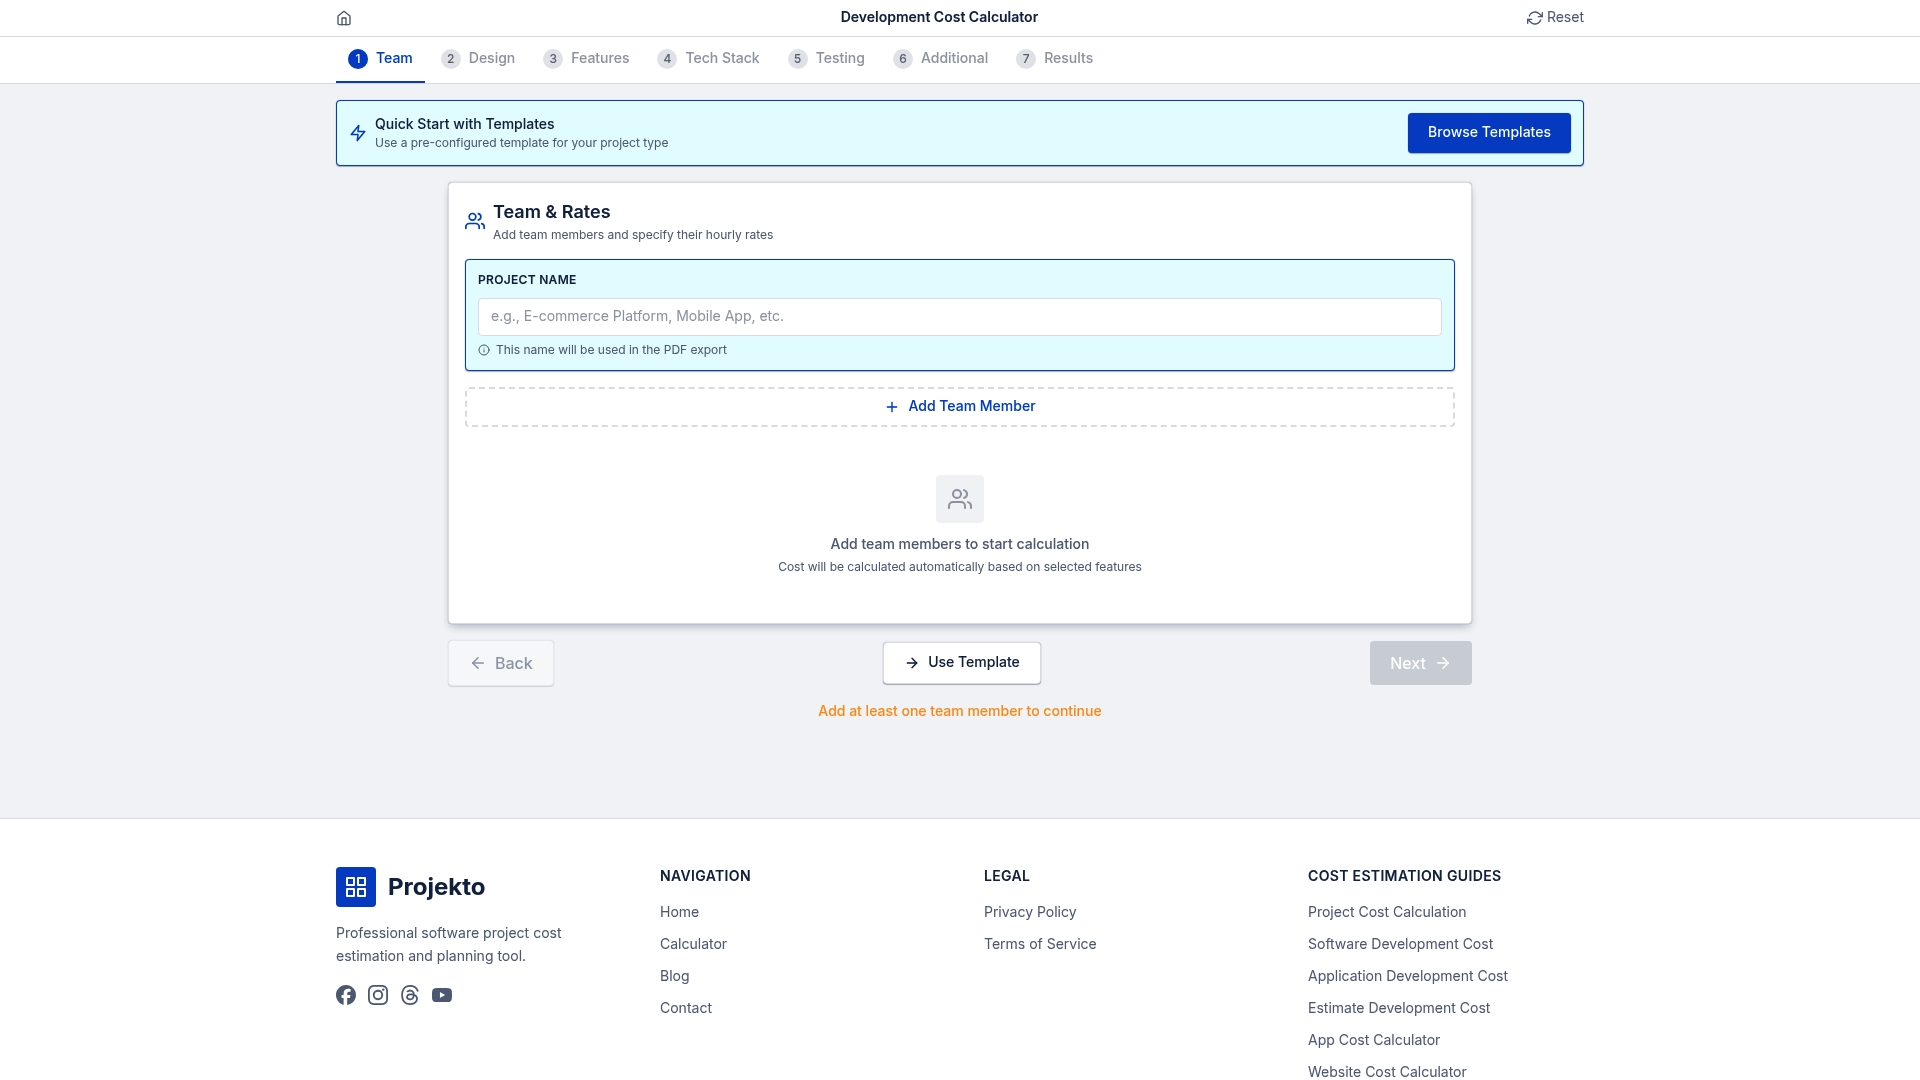
The development cost calculator at Projecto Calculator gives project managers and business decision-makers a structured way to forecast both development and QA resource requirements before committing to a budget. By combining estimation best practices with a purpose-built planning tool, you can align test coverage strategy with realistic time and cost constraints from day one.
Frequently asked questions
What is the main goal of test coverage estimation?
The goal is to determine the right amount and focus of testing needed to maximize quality and business value within budget and time constraints. Test coverage estimation involves predicting and planning the extent of testing needed to achieve optimal quality within those limits.
Is 100% test coverage necessary in software projects?
No. 80% targeted coverage is often more effective and efficient for web and mobile projects than pursuing 100%, which delivers diminishing returns at significantly higher cost.
Which estimation technique should I use for a new mobile app?
Start with risk-based estimation to prioritize device, OS, and network compatibility, then apply a work breakdown structure for detailed scope. Risk-based testing and WBS are the most practical combination for mobile and web projects.
Do higher coverage numbers always mean better quality?
Not necessarily. It is more important to cover critical risks and real-world scenarios than to maximize raw coverage percentage. High coverage does not equal a bug-free product; quality of test design matters more than quantity.
What tools can help with test coverage estimation?
Project estimation calculators and analytics-driven tools help forecast resource needs and track coverage priorities. Analytics and estimation tools provide more accurate app project coverage planning than manual spreadsheet approaches.