
You've probably heard teams throw around terms like story points, velocity, and sizing during sprint planning, but what does software sizing actually mean? Many project managers confuse sizing with effort or time estimation, leading to missed deadlines and budget overruns. Software sizing is fundamentally about quantifying functional scope, not predicting how long work will take. Understanding this distinction transforms how you approach project planning and resource allocation. This guide clarifies what software sizing really means, explains how it connects to effort estimation through velocity, and shows you practical techniques to size projects accurately for better budget control and timeline predictability.
Table of Contents
- Key takeaways
- Understanding software sizing: definition and purpose
- Common software sizing units and techniques
- The relationship between sizing, velocity, and effort estimation
- Best practices and pitfalls when sizing software projects
- Explore our software project estimation tools
- Frequently asked questions
Key Takeaways
| Point | Details |
|---|---|
| Sizing measures scope | Sizing quantifies what needs to be built rather than predicting how long it will take. |
| Velocity ties size to effort | Velocity converts size estimates into realistic timelines based on team performance. |
| Break down large stories | Decomposing large features into smaller pieces improves estimate accuracy and planning reliability. |
| Improve budget predictability | Clear sizing and velocity data enable more accurate cost projections. |
Understanding software sizing: definition and purpose
Software sizing quantifies the functional scope of a project by measuring what needs to be built, not how long it will take to build it. This distinction matters because scope remains constant while effort varies based on team skill, technology choices, and process efficiency. When you size a project, you're creating an inventory of features and functionality using standardized units that remain independent of resource allocation.
Story points represent the most common sizing unit in Agile environments. Unlike hours, story points measure relative complexity and effort without tying directly to calendar time. A 5 point story is roughly five times more complex than a 1 point story, but the actual hours required depend on your team's velocity. This separation allows teams to focus on what's being built during sizing sessions, then apply empirical velocity data to predict timelines.
The power of sizing lies in its role as a planning foundation. Clear sizing enables better prioritization because stakeholders can compare the relative size of features against business value. You can sequence work more effectively when you know which features represent larger scope investments. Budget planning becomes more reliable when you translate consistent sizing units through measured velocity into realistic cost projections.
Proper software development cost estimation starts with accurate sizing. Without it, you're guessing at both scope and effort simultaneously, compounding uncertainty. Sizing first, then applying velocity second, reduces this compound error. Teams that cap story points at 8 force themselves to decompose large features into manageable pieces, improving estimate accuracy significantly.
Key benefits of implementing clear sizing practices include:
- Improved budget accuracy through consistent scope measurement
- Better risk management by identifying complexity early
- Enhanced stakeholder communication with standardized metrics
- Stronger prioritization decisions based on size versus value tradeoffs
- More realistic schedules derived from empirical velocity data
Different methods for software sizing suit different project types and organizational maturity levels. The critical factor is choosing a method and applying it consistently so your historical data becomes meaningful for future estimation.
Common software sizing units and techniques
Story points dominate Agile sizing because they measure relative complexity without prescribing specific time commitments. Teams assign points using a Fibonacci sequence, where each number represents a meaningful difference in complexity. A 3 point story might involve straightforward CRUD operations, while an 8 point story could require third party API integration with error handling. The key is consistency within your team's context, not absolute definitions.

Function points provide a more formal, quantitative approach tied directly to software functionality. This method counts inputs, outputs, inquiries, internal files, and external interfaces, applying complexity weights to each. Function points work well for waterfall projects or when you need vendor independent sizing for contract negotiations. The International Function Point Users Group maintains detailed counting standards, making this method reproducible across organizations.
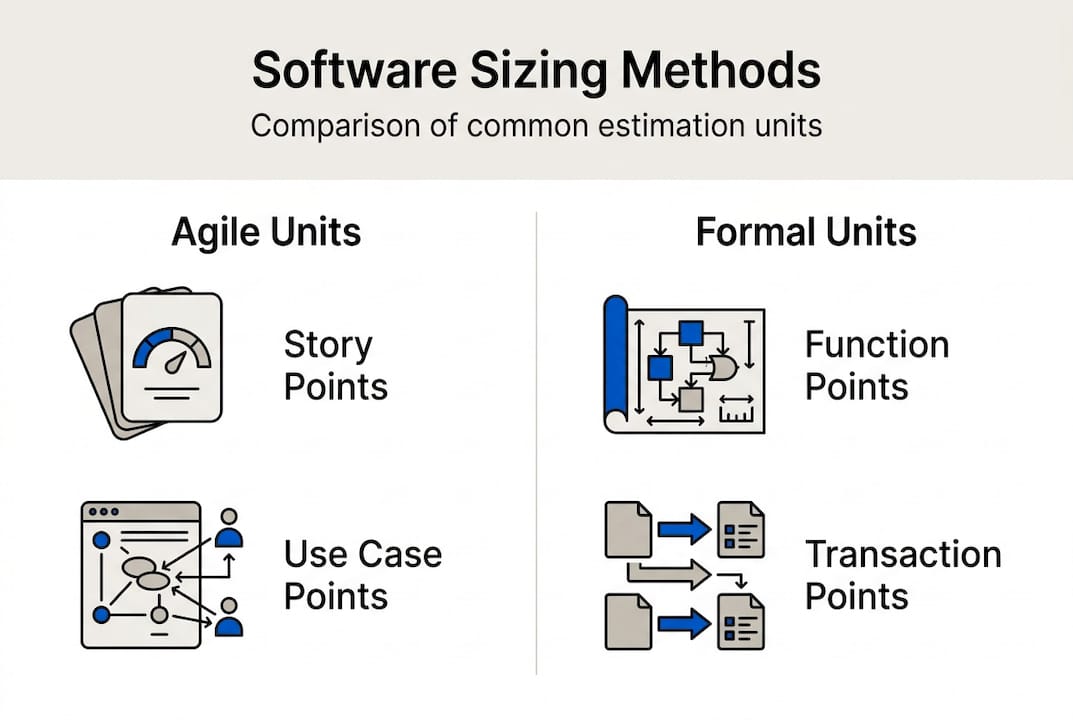
Use case points focus on transaction scenarios and actor complexity to size projects. You identify use cases, classify them by complexity, count actors, and apply technical and environmental factors. This technique suits projects where user interactions drive scope, particularly business applications with well defined workflows. Use case points translate more directly to traditional project management frameworks than story points.
| Sizing method | Best for | Advantages | Disadvantages |
|---|---|---|---|
| Story points | Agile teams, iterative development | Quick, team focused, promotes collaboration | Requires established velocity, not comparable across teams |
| Function points | Formal contracts, waterfall projects | Standardized, vendor independent, detailed | Time intensive, requires training, less flexible |
| Use case points | Business applications, scenario driven projects | User focused, good for requirements analysis | Complex calculation, less common, limited tooling |
Pro Tip: Always cap story points around 8 to ensure stories are decomposed properly for better estimation. Large stories hide complexity and create estimation variance that undermines planning accuracy.
The choice between sizing methods depends on your project context and organizational needs. Agile teams benefit from story points' speed and flexibility. Organizations managing multiple vendors or fixed price contracts often prefer function points' standardization. Teams transitioning from waterfall to Agile sometimes start with use case points before moving to story points.
Regardless of method, consistency matters more than perfection. Your estimate software development cost accuracy improves when you apply the same sizing approach across projects, building a historical database of actual performance. This data becomes invaluable for refining future estimates and identifying patterns in your team's delivery capability.
Modern app cost calculator tools often incorporate multiple sizing methods, allowing you to compare approaches and validate estimates through triangulation. Using two methods on critical projects provides a sanity check and exposes hidden complexity.
The relationship between sizing, velocity, and effort estimation
Velocity measures how many story points your team completes per sprint, providing the empirical bridge between size and effort. After several sprints, velocity stabilizes into a predictable range that reflects your team's actual delivery capacity. A team averaging 40 points per two week sprint can reliably predict that a 200 point project requires approximately five sprints, translating size into a concrete timeline.
Converting size to effort requires this measured velocity data, not guesses about productivity. Here's the step by step process:
- Complete initial project sizing using your chosen method to establish total story points
- Measure team velocity over at least three sprints to establish a baseline average
- Divide total story points by average velocity to calculate required sprint count
- Multiply sprint count by sprint duration to determine project timeline
- Apply team cost per sprint to calculate total project budget
This approach works because velocity empirically measured post sprint reflects real team performance including meetings, code reviews, testing, and all the overhead that theoretical hour estimates miss. Your velocity already accounts for sick days, context switching, and technical debt remediation because these factors affected previous sprints.
Accuracy improves when you track velocity trends rather than relying on single sprint data points. Velocity fluctuates due to holidays, team changes, and technical challenges. Calculate a rolling average over the most recent six sprints, excluding obvious outliers like sprints disrupted by major production incidents. This smoothed velocity provides more reliable estimation input.
Pro Tip: Avoid guessing velocity for new teams. Run two or three sprints on actual project work, even if it's initial setup and architecture, to establish real velocity before committing to delivery dates. Estimated velocity is often 50% higher than actual performance.
"Size is not effort or time. Use velocity, empirically measured after each sprint, to convert your size measurements into reliable effort predictions. This separation of concerns dramatically improves estimation accuracy."
The software development cost distinction between size and effort prevents common planning failures. Teams that estimate directly in hours often underestimate because they forget non coding activities. Teams that size first, then apply velocity, capture the full reality of software delivery in their estimates.
Velocity also enables flexible planning. When priorities shift mid project, you can re sequence the backlog without re estimating everything. The sized stories retain their point values while velocity determines which subset fits into remaining sprints. This flexibility is impossible when estimates are tightly coupled to specific resource assignments and calendar dates.
For distributed teams or software development cost marketplace scenarios, velocity becomes even more critical. Different teams have different velocities even when using the same sizing scale. Measuring each team's velocity separately allows accurate multi team planning and workload distribution.
Best practices and pitfalls when sizing software projects
Teams frequently make these sizing mistakes that undermine estimation accuracy:
- Conflating size with effort by assigning story points based on expected hours rather than relative complexity
- Estimating large user stories without decomposition, hiding complexity and creating high variance
- Failing to update velocity calculations as team composition or technology stack changes
- Inconsistent sizing standards where different team members apply different complexity criteria
- Skipping refinement sessions that align team understanding of story scope and acceptance criteria
Decomposition represents the single most powerful technique for improving sizing accuracy. When you encounter a story that feels like 13 or 21 points, that's a signal to break it down. Large stories contain hidden complexity that teams discover mid sprint, causing delays and rework. Capping story points at 8 forces this decomposition discipline, resulting in smaller, better understood work units.
Continuous refinement during sprints keeps sizing current as understanding evolves. Schedule weekly backlog refinement sessions where the team reviews upcoming stories, asks clarifying questions, and updates estimates based on new information. Stories estimated three months ago often need revision as architecture decisions and technical constraints become clearer. This ongoing calibration prevents estimation drift.
Cross functional team involvement in sizing workshops improves accuracy by incorporating diverse perspectives. Developers see technical complexity, designers identify user experience challenges, and QA engineers flag testing requirements. When all disciplines contribute to sizing, you capture the full scope of work required. Silent individual estimation followed by discussion resolves the widest gaps and builds shared understanding.
Pro Tip: Use historical data from completed projects to calibrate new estimates. Track actual story points delivered versus initial estimates to identify systematic bias. If your team consistently underestimates database heavy features by 30%, apply that correction factor to similar future stories.
Consistent sizing across projects requires documented standards. Create a reference set of previously completed stories at each point level that new team members can review. These examples anchor the team's sizing scale, preventing drift over time. When someone proposes a 5 point estimate, compare it against your reference 5 point stories to validate consistency.
Common cost for application development estimation errors stem from sizing inconsistencies. A project sized by one team using their internal scale cannot be compared to another team's estimates without velocity normalization. This is why velocity matters more than the absolute point values. Focus on maintaining consistent sizing within your team, then let empirical velocity translate that sizing into accurate effort predictions.
Avoid these estimating software size errors by treating sizing as a team discipline, not an individual task. Planning poker and similar collaborative techniques surface assumptions and build consensus. The discussion that happens when estimates diverge often reveals requirements gaps or technical considerations that improve both sizing accuracy and implementation quality.
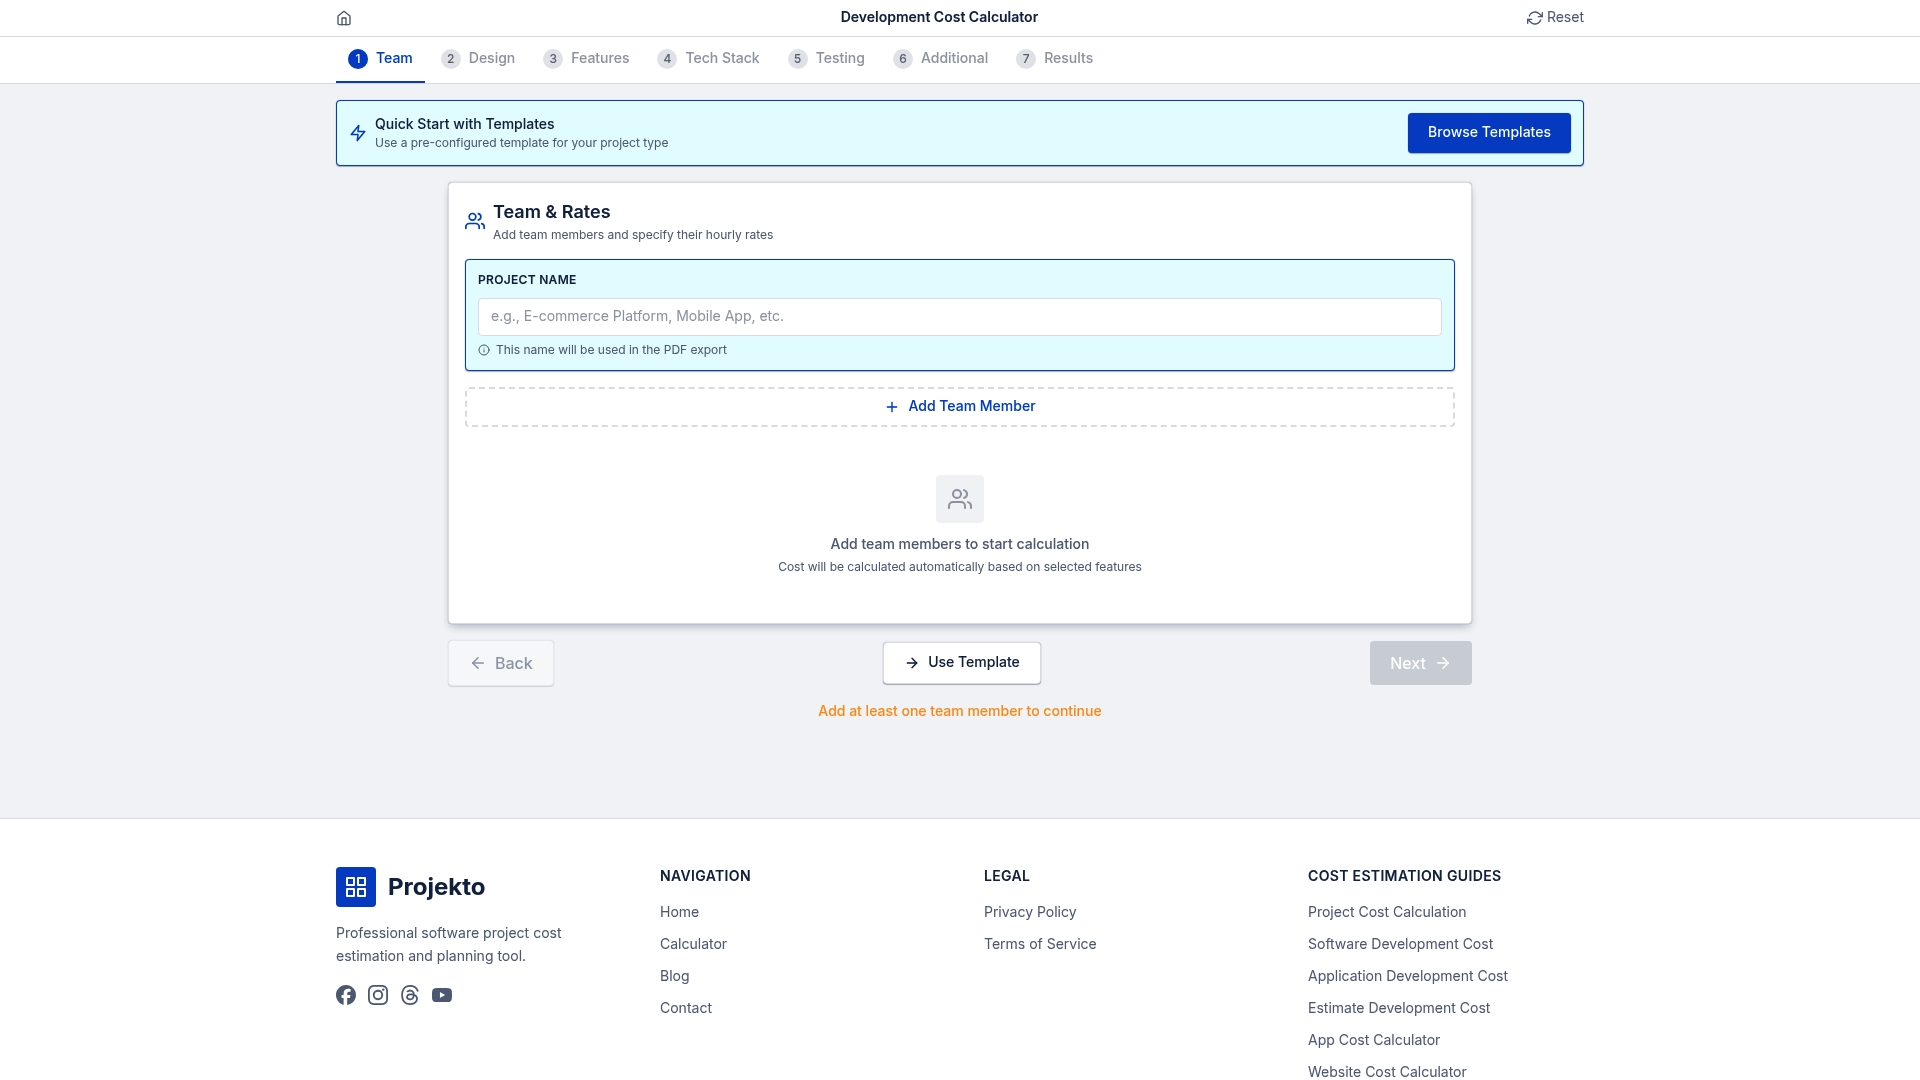
Explore our software project estimation tools
Ready to apply these sizing principles to your next project? Our interactive development cost calculator helps you translate feature scope into realistic budget and timeline estimates. Built on industry benchmarks and proven estimation frameworks, the calculator guides you through feature selection and complexity assessment to generate detailed project estimates.
Explore real world examples like our project management app cost estimate to see how different feature combinations affect total project scope and budget. Compare your project against similar applications to validate your sizing assumptions and identify potential cost drivers early in planning.
For consumer facing applications, check out our travel booking app cost estimate which breaks down complex integrations, user flows, and backend requirements into transparent cost components. These detailed estimates show how proper sizing translates into accurate budget planning.
The calculators incorporate the sizing principles covered in this guide, helping you move from theoretical understanding to practical application. Get custom estimates reflecting your specific project parameters, team size, and technology choices in minutes.
Frequently asked questions
What is software sizing?
Software sizing quantifies the functional scope and complexity of a project using standardized measurement units like story points or function points. It measures what needs to be built, independent of how long it will take or who will build it. Sizing provides the foundation for effort estimation by establishing a consistent scope baseline that teams can reference throughout project planning and execution.
How does software sizing differ from effort estimation?
Sizing quantifies scope and functionality while effort estimation predicts the resources and time needed to deliver that scope. Sizing uses relative units like story points that remain constant regardless of team composition. Effort estimation applies team velocity to those sizing units, translating them into hours, sprints, or calendar duration based on actual team performance data.
What units are commonly used for software sizing?
Story points, function points, and use case points represent the most common sizing units. Story points measure relative complexity in Agile environments and work well for iterative development. Function points provide standardized functional measurement suitable for formal contracts and vendor comparisons. Use case points focus on user scenarios and transaction complexity, working best for business applications with defined workflows.
How is velocity used to estimate effort?
Velocity measures how many story points a team completes each sprint, providing an empirical conversion factor from size to effort. Divide your total project story points by average team velocity to calculate the number of sprints required. Multiply sprint count by sprint duration to determine project timeline, and apply team cost per sprint to calculate total budget. This approach grounds estimates in actual team performance rather than theoretical productivity assumptions.